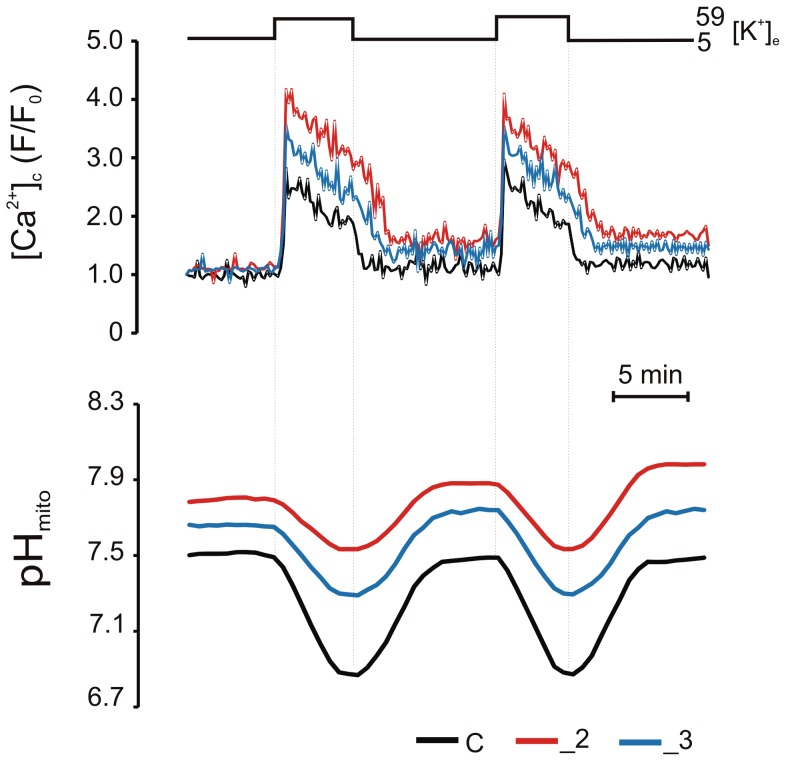
Figure 3. Ca2+- and PMCA-dependent mitochondrial acidification.
Cells expressing mitoSypHer were loaded with 10 µM Fura-2 for 1 h and simultaneous changes in Fura-2/mitoSypHer fluorescence were recorded in single cells. The traces show the mean response of (Ca2+)c (upper panel) and pHmito (lower panel) in n = 11 cells for C, _2, _3 lines following repetitive 59 mM KCl stimulation and recovery.

