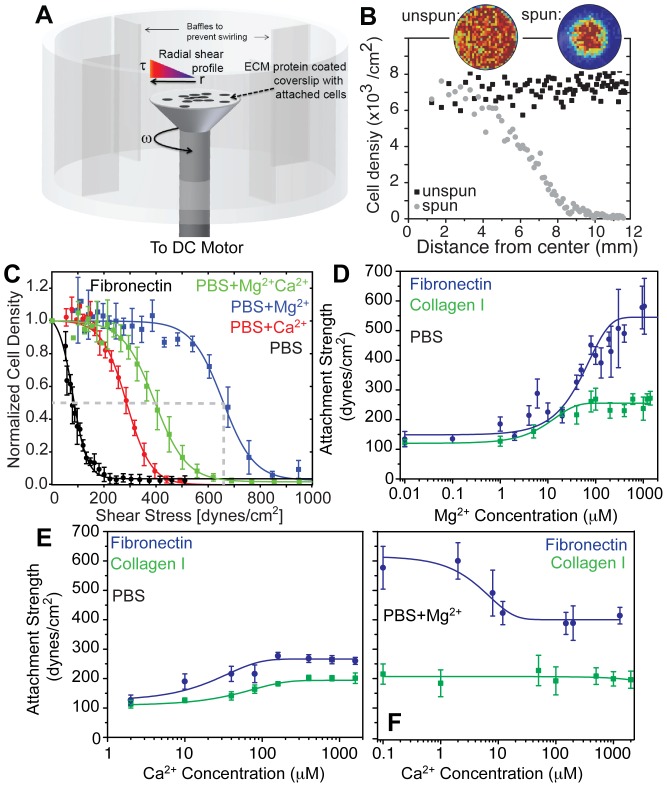
Figure 1. Fibroblast adhesion strength is ligand- and cation-dependent.
(A) Illustration of the Spinning Disc device with cells attached to an extracellular matrix protein-coated coverslip mounted and rotating on a spinning rod in buffer. The radially-dependent shear profile is highlighted showing that cells at the center only rotate in place while those at the edge move around at a high linear velocity. (B) Plot of cell density versus coverslip position for cells that were exposed to shear (spun, gray circles) or were not (unspun, black squares). Inset images show heat maps of cell density for the indicated conditions. (C) Normalized 3T3 cell density was plotted vs. applied shear for cells with or without 0.5 mM Mg2+ and with or without 1 mM Ca2+ during the 5 min of application of shear as indicated. Note that each representative curve represents thousands of cells bound at set radial distances with data expressed as mean ± standard deviation. (D) Adhesion strength, T 50 (measured in dynes/cm2), shown for 3T3 cells on fibronectin- (blue) and type I collagen-coated substrates (green) in absence of calcium but in the presence of 0.01–1000 µM Mg2+. Data are fit by sigmoidal curves. (E) Adhesion strength, T 50 (measured in dynes/cm2), shown for 3T3 cells on fibronectin- (blue) and type I collagen-coated substrates (green) in the presence of 1–1000 µM Ca2+ without Mg2+ present. Data are fit by sigmoidal curves. (F) While keeping Mg2+ constant at 0.5 mM, adhesion strength was measured as a function of Ca2+ for both fibronectin- (blue) and type I collagen-coated substrates (green). Note that each data point in panels D-F represents triplicate experiments of thousands of cells from a coverslip exposed to a radial shear gradient. Data is expressed as mean ± standard deviation of T 50 for each shear test at the indicated cation condition.

