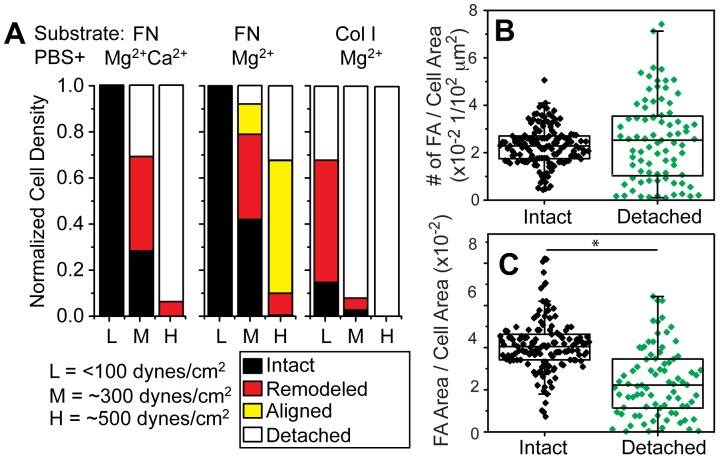
Figure 4. Analysis of Cell Detachment Mechanisms.
(A) The occurrence of different detachment modes are indicated for cells treated with the indicated matrix ligands, cation concentrations, and shear. Cells were characterized as: 1) “Remodeled”, defined as nucleus present but visible cell deformation with paxillin puncta surrounding the cell, e.g. center and lower right images of Figure 3 (please note that no differentiation was made between deformed cells and aligned cells as the differences are gradual until full alignment is reached), 2) “Aligned”, defined as cells aligned in the direction of shear determined by a combination of cell aspect ratio and direction of major axis, 3) “Detached”, determined from the density difference between other conditions and unspun cells cells. For each condition the same surface area was scanned and analyzed, where the low shear region, e.g.<100 dynes/cm2, contained at least 100 cells. Focal adhesion density, (B) based on number of discrete adhesions or (C) on the area of those adhesions versus cell area, was determined for intact cells or detached cells that left behind paxillin-containing puncta. For detached cells, the area was determined by the maximum extent of the puncta. For each condition, at least 80 intact cells from triplicate experiments were scanned and analyzed. *p<0.05.

