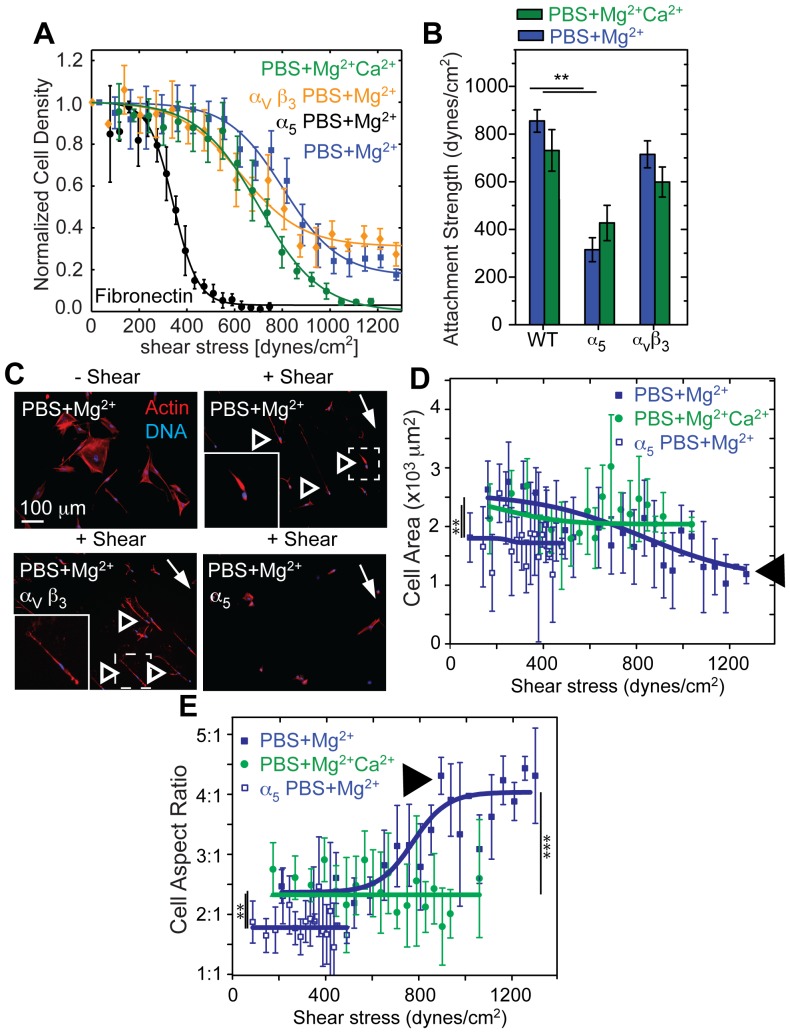
Figure 6. α5 Integrins Regulate Cell Remodeling under Shear.
(A) WI38 fibroblast adhesion strength was tested under the indicated conditions. Note that each representative curve represents thousands of cells grouped together at set radial distances with data expressed as mean ± standard deviation. (B) Average adhesion strength (T 50) for WI38 fibroblasts for the indicated conditions from triplicate experiments. (C) Fluorescent images of WI38 cells stained pre- or post-shear for nuclei (DNA; blue) and actin (red). Shear direction is indicated by a white arrow and remodeled cells are indicated by open arrowheads. Dashed lines indicate the regions of inset images, which are outlined in white. (D) Cell area vs shear stress of WI38 cells is plotted. Only when engaged with α5 integrins and in absence of Ca2+ did cell area decrease significantly with increasing shear (black arrow head). Please note that cells with blocked α5 integrins or in presence of Ca2+ detach at lower shear. (E) Cell aspect ratio vs shear stress of WI38 cells is plotted. Only when engaged with α5 integrins and in absence of Ca2+ did cell aspect ratio significantly increase with increasing shear (black arrow head). For panels D and E, statistical tests were performed between the different conditions indicated as a function of shear using non-parametric Kruskal-Wallis analysis of variance. Note that data was grouped together at set radial distances expressed as mean ± standard deviation for each curve and represents thousands of cells. Statistical analysis for all other panels were performed as indicated in the methods section. *p<0.05, ** p<0.01, ****p<0.0001.

