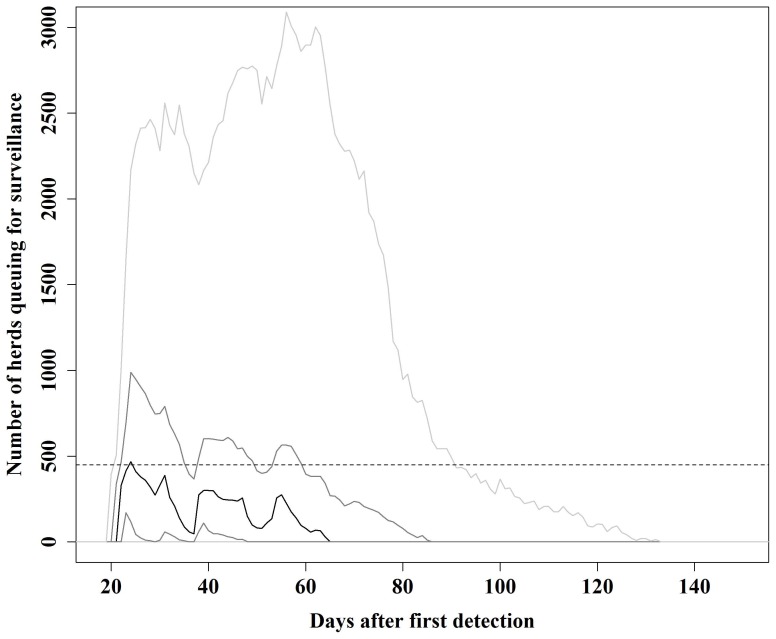
Figure 1. Total number of herds queuing for surveillance visits, for each day, when epidemics were initiated in cattle herds located in areas with high cattle density.
A basic control strategy as described by Danish and European legislation was modelled. The black line represents the 50th percentile, the dark gray lines represent the 25th and 75th percentiles and the light gray lines represent the 5th and 95th percentiles. The interrupted line represents the daily surveillance capacity of 450 herds.

