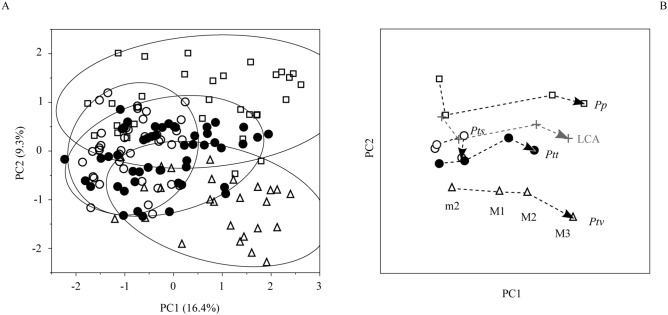
Figure 1. Femoral diaphyseal shape variation in an ontogenetic sample of Pan taxa.
A: Variation along the first two principal components of shape, PC1 and PC2 (filled circles: P.t. troglodytes, open circles: P.t. schweinfurthii, open triangles: P.t. verus, open squares: P. paniscus). Solid outlines show 95%-density ellipses for each taxon. B: plot of mean shapes at consecutive ontogenetic stages. m2: second deciduous molar erupted; M1/M2/M3: permanent molars 1/2/3 erupted. Gray symbols and dashed line indicate the inferred shape at each ontogenetic stage and ontogenetic trajectory of the last common ancestor.

