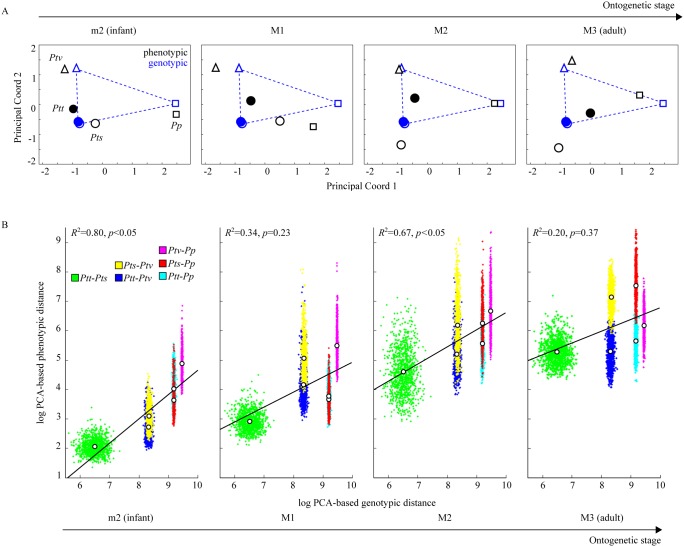
Figure 3. Comparison of genotypic and phenotypic distances between Pan taxa.
A: Principal Coordinates Analysis (PCO) permits representation of genotypic and phenotypic distance data in the same multivariate space. The four subgraphs show phenotypic data (black dots) for consecutive ontogenetic stages m2, M1, M2, and M3, and genotypic data (same blue dots for all stages). For graphical clarity genotypic data points, which are independent of ontogenetic stage, are connected with dashed lines. Note that during ontogeny the phenotypic distance configuration departs from the neutral genetic distance configuration (see also Fig. S5). B: Correlation between phenotypic and neutral genetic distances between taxa. Each point cloud consists of 1000 randomly sampled phenotypic and genotypic distances between individuals belonging to different Pan taxa (resampling procedures are explained in Text S1). Correlation of phenotypic and neutral genetic distances is highest at the m2 (infant) stage and declines towards adulthood (M3). Genetic and phenotypic distances are normalized by their respective median values. Note overall increase of phenotypic distance between taxa toward adulthood.

