
Figure 1. Validation of ZFP36 target genes inferred from MIC analysis of microarray gene expression data.
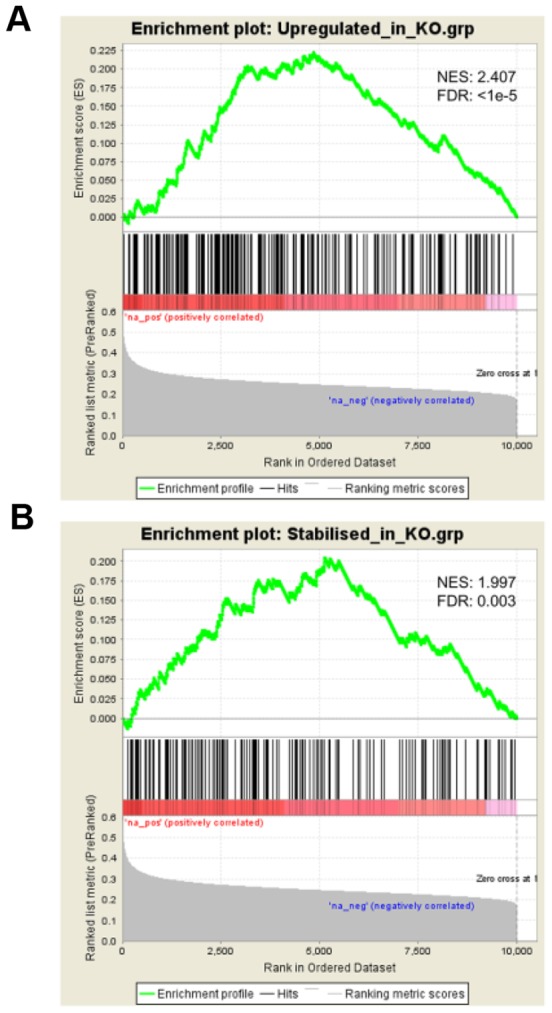
Gene set enrichment analysis [20] profiles are shown for 10016 genes, rank-ordered by MIC score. Normalised Kolmogorov-Smirnov enrichment scores (NES) and false discovery rate q values (FDR) are shown. (A) using a gene set (n = 237) representing mRNAs that are significantly up-regulated in Tis11/ZFP36-knock-out mouse fibroblasts [21], (B) using a gene set (n = 152) representing mRNAs that display a significantly decreased rate of degradation in Tis11/ZFP36-deficient mouse fibroblasts [22].