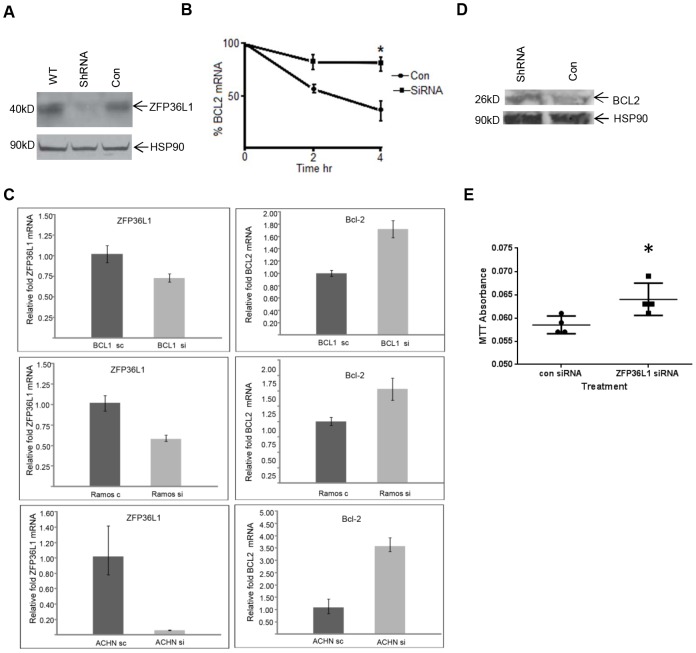
Figure 4. Modulation of ZFP36L1 expression levels is associated with changes in BCL2 mRNA levels in different cell types.
(A) Western blot analysis showing Zfp36L1 protein expression in wild-type, ZFP36L1 ShRNA and control empty lentivirus transduced BCL1 cells. Cell Signaling Technology rabbit-anti-human ZFP36L1/L2 antibody was used to detect Zfp36l1 expression. An anti-HSP90 antibody was used as a control for protein loading on the gel. (B) BCL2 mRNA degradation analysis following actinomycin D treatment in Zfp36l1-knockdown and control murine leukemia BCL1 cells. qRT-PCR analysis of Bcl2 mRNA levels over a 4 hour time course in control (empty lentivirus transduced BCL1 cells) and zfp36l1-knockdown BCL1 cells. Cells were treated with 5 µg/ml of actinomycin D for 0, 2, and 4 hours. The results are from 3 independent experiments and show mean ±SEM. * = p<0.05 as determined by student T test. (C) ZFP36L1 and BCL2 mRNA levels were measured by qRT-PCR in BCL1, ACHN and Ramos cells. Lentiviral mediated ZFP36L1 ShRNA was used to knockdown ZFP36L1 mRNA levels in BCL1, ACHN and Ramos cells. qRT-PCR analysis was carried out as described in Methods. Control cells were transduced with lentivirus containing scramble sequence (BCL1, ACHN) or empty lentivirus (Ramos). Mean ±SEM for triplicate samples are shown. These results are representative of at least 2 independent experiments done on each cell type. (D) BCL2 protein expression in ZFP36L1 ShRNA transduced or empty lentivirus (con) transduced Ramos cells. An anti-HSP90 antibody was used as a control for protein loading on the gel. (E) Following either ZFP36L1 or control siRNA oligonucleotide transfection, Ramos cells were treated with ionophore (A23187, 150 nM) and, 24 h later, MTT levels were measured. The results shown are from 4 independent experiments, mean ±SEM are shown. * = p<0.05 as determined by student T test.

