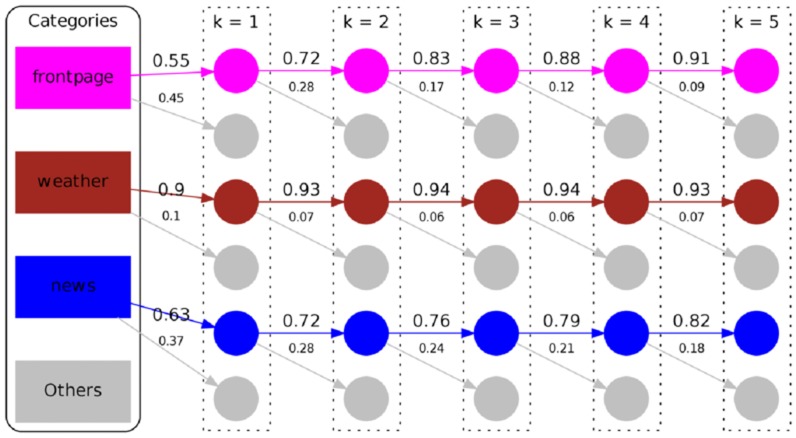
Figure 12. Self transition structure of navigation for the MSNBC dataset.
The number of times users stay within the same topic vs. the number of times they change the topic during navigation for different values of  . Only the top three categories with the highest transition probabilities are shown. With high consistency, the transition probabilities to the same topic increase while those to other categories decrease with ascending order
  .
.

