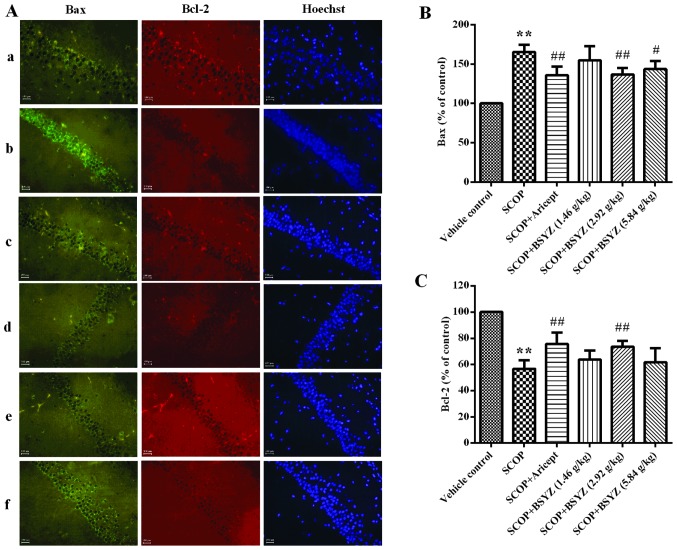
Figure 5.
Immunofluorescent staining of Bax and Bcl-2 in the hippocampus of mice. (A) The expression of Bax and Bcl-2 in the hippocampus of SCOP-treated mice analyzed by immunofluorescent staining (scale bar, 100 μm; original magnification, ×400). Bax was labeled with FITC (green) and Bcl-2 was labeled with Cy3 (red). a, Vehicle control; b, SCOP; c, SCOP + Aricept; d, SCOP + Bushen-Yizhi formula (BSYZ) (1.46 g/kg); e, SCOP + BSYZ (2.92 g/kg); f, SCOP + BSYZ (5.84 g/kg). (B) Percentage in mean fluorescence intensity (MFI) of Bax to the vehicle control mice. (C) Percentage in MFI of Bcl-2 compared to the control mice. Data are shown as the mean ± SE (n=3). **P<0.01 versus the vehicle control mice. #P<0.05 and ##P<0.01 versus the SCOP-treated mice.

