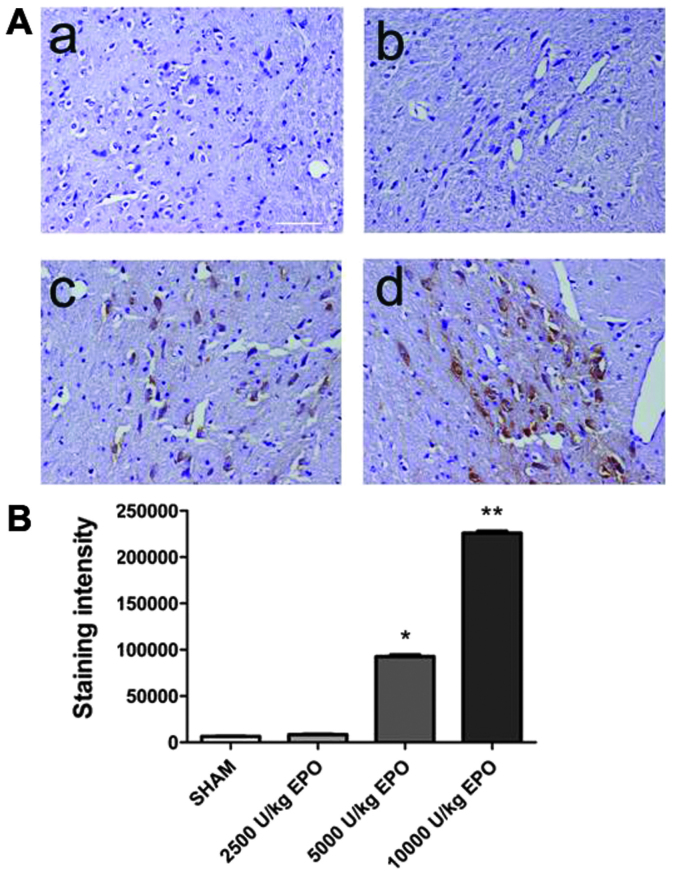
Figure 2.
Expression of erythropoietin (EPO) immunoreactivity in brain after three doses of EPO. (A) Immunocytochemistry of EPO in rats’ brain. (B) Statistic of the EPO immunocytochemistry. The first group (sham, a) received an injection of saline. The second group (b) received EPO (2,500 U/kg). The third group (c) received EPO (5,000 U/kg). The fourth group (d) received EPO (10,000 U/kg). Data are the mean ± SEM; n=7 for each group. *P<0.01; **P<0.01 vs. sham (ANOVA). Scale bar, 100 μm.

