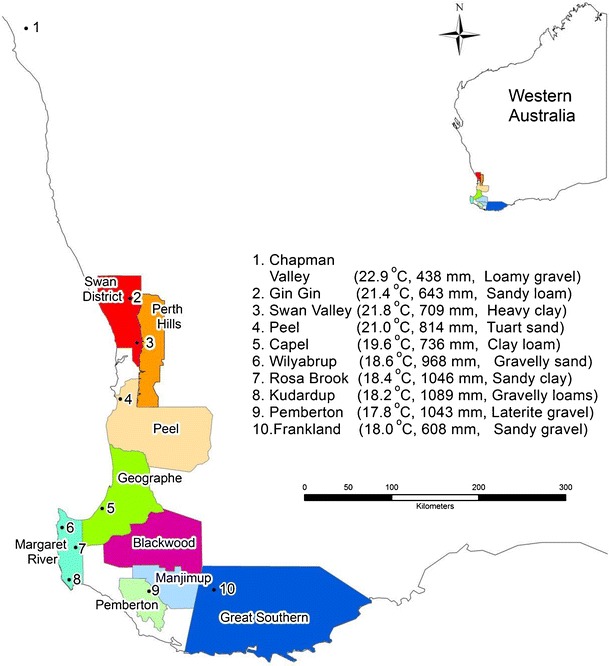
Fig. 1.

Map of study areas in Western Australia. Numbered dots in enlarged picture represent study site locations. October–April average temperature, average annual rainfall, and dominant soil types for each site are indicated in parentheses. Climate data (average for the 1976–2005 period) was obtained from SILO DataDrill database (Jeffrey et al. 2001)
