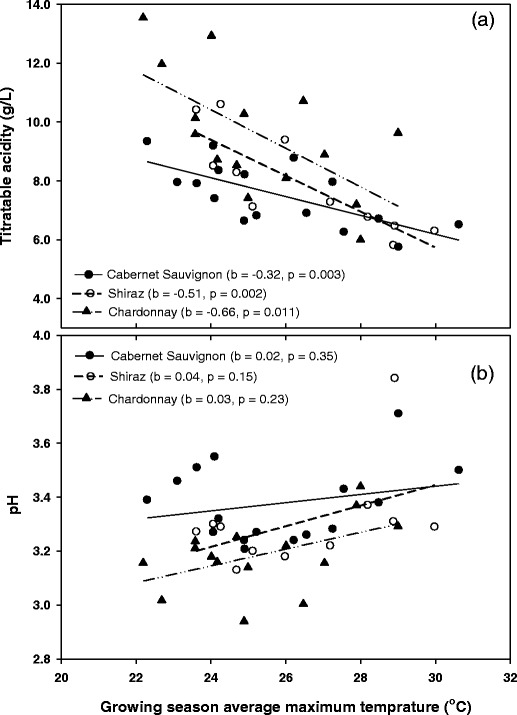
Fig. 5.

Relationships between berry a TA, b pH and the growing season maximum temperature for Cabernet Sauvignon (filled circles), Shiraz (open circles) and Chardonnay (triangles). Data points represent sites. b Slope of the regression, P probability of the trend line being different from zero
