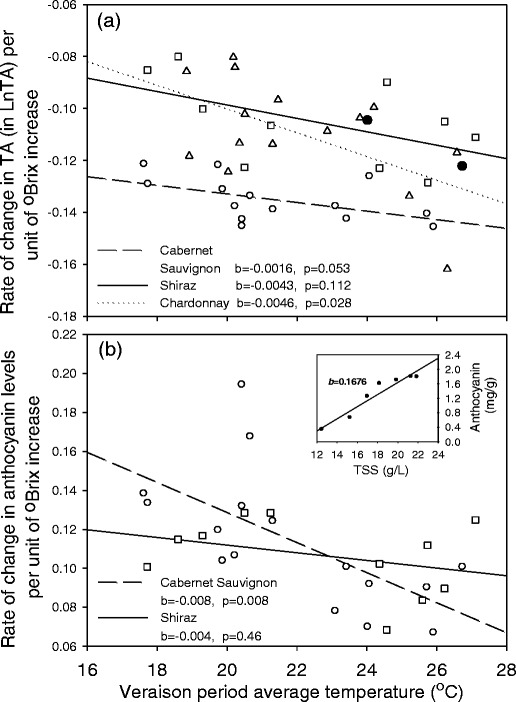
Fig. 6.

Relationships between the veraison period average temperature and rates of change in a TA, b anthocyanin concentration per unit of TSS increase for Cabernet Sauvignon (circles), Shiraz (squares) and Chardonnay (triangles). Two extreme values of (filled circles) Cabernet Sauvignon TA were not included in the regression. Inset Estimation of the rates of change of quality attributes over the veraison to harvest period using the sequential sampling data for the Kudardup site in Season 2
