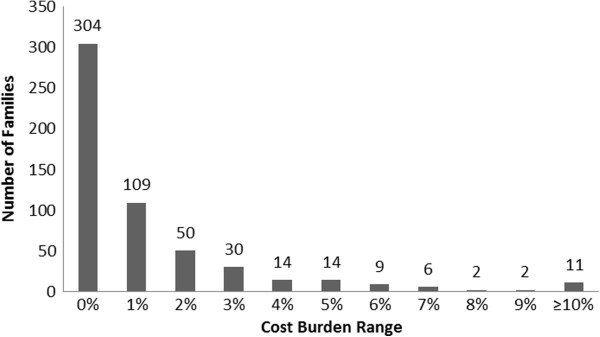
Figure 1.

Histogram of cost burden incurred for a single episode of pediatric diarrhea in a sample of 551 Bolivian infants seeking care for acute diarrheal illness, 2007 – 2009. Over 40% of Bolivian families in our study spent at least 1% of their annual income on a single episode of pediatric diarrhea. The black bars represent number of patients in each cost burden category, with total number of patients at the top of the column. Each column (cost burden category) represents a range of one percentage point, for example, 0% = 0 - <1%. (N = 551).
