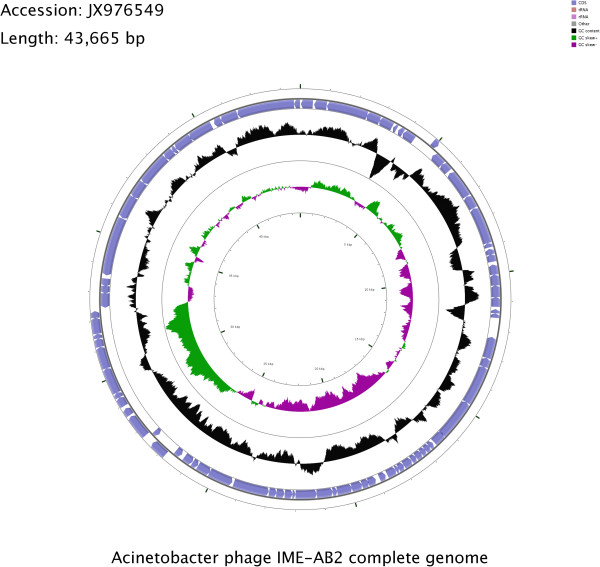
Figure 5.

Circular map of the IME-AB2 genome prepared using CGView. The outer ring denotes the IME-AB2 genome and CDSs. The inner rings show G + C content and G + C skew, where peaks represent the positive (outward) and negative (inward) deviation from the mean G + C content and G + C skew, respectively.
