Figure 1.

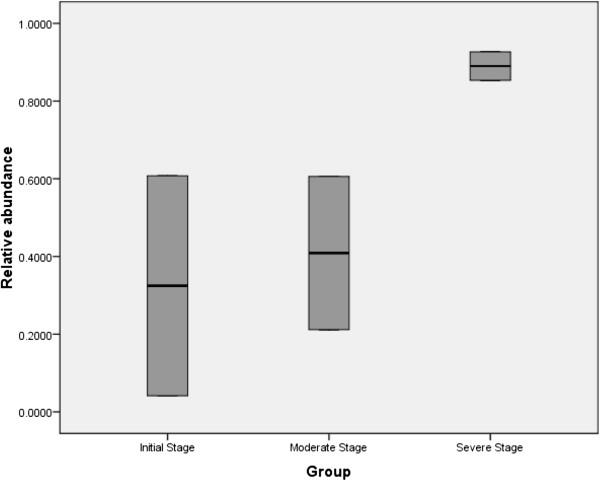
Box Plot showing the overall prevalence of phylum Proteobacteria in samples from UC patients at three different clinical stages ( p -value = 0.031).

Box Plot showing the overall prevalence of phylum Proteobacteria in samples from UC patients at three different clinical stages ( p -value = 0.031).