Figure 5.

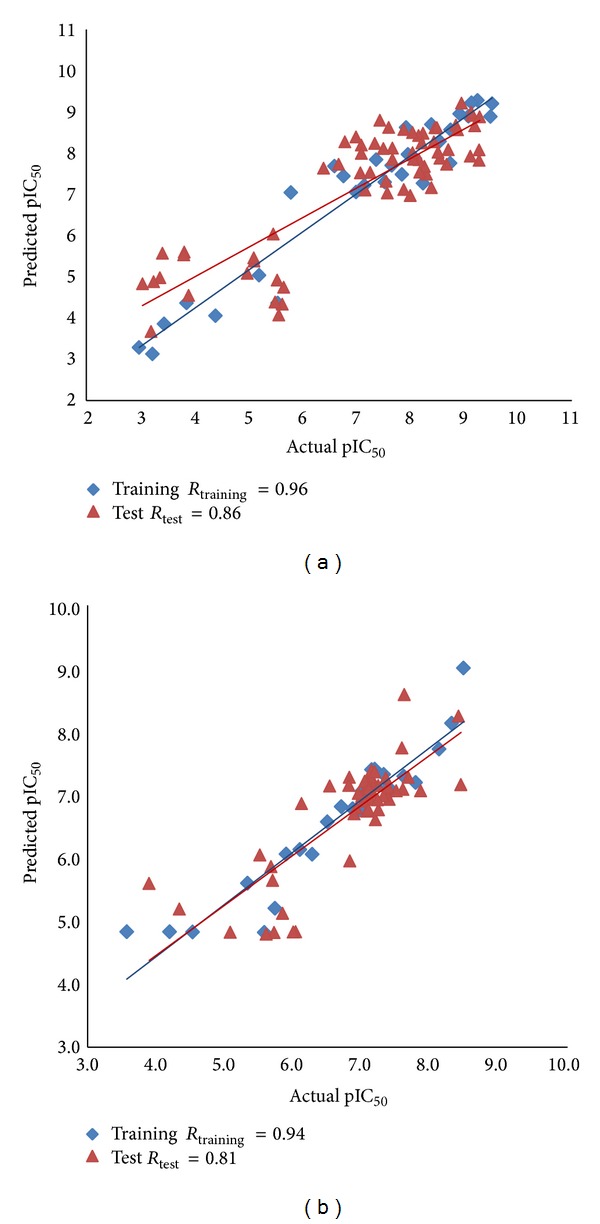
Correlation plot between the experimental and predicted activity. (a) For AChEIs by Hypo1_A for the training set and test set compounds. (b) For BChE inhibitors by Hypo1_B for the training set and test set compounds.

Correlation plot between the experimental and predicted activity. (a) For AChEIs by Hypo1_A for the training set and test set compounds. (b) For BChE inhibitors by Hypo1_B for the training set and test set compounds.