Figure 2.

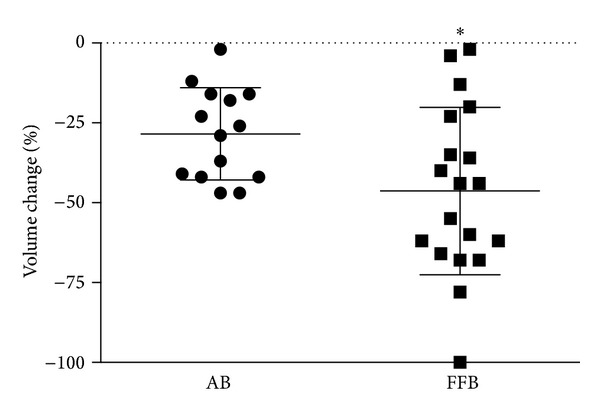
Graft depicting change in volume of AB and FFB grafts based on CT data after 6 months. The volume of grafts in both groups decreased over time, though to a greater extent for FFB grafts, *P = 0.028.

Graft depicting change in volume of AB and FFB grafts based on CT data after 6 months. The volume of grafts in both groups decreased over time, though to a greater extent for FFB grafts, *P = 0.028.