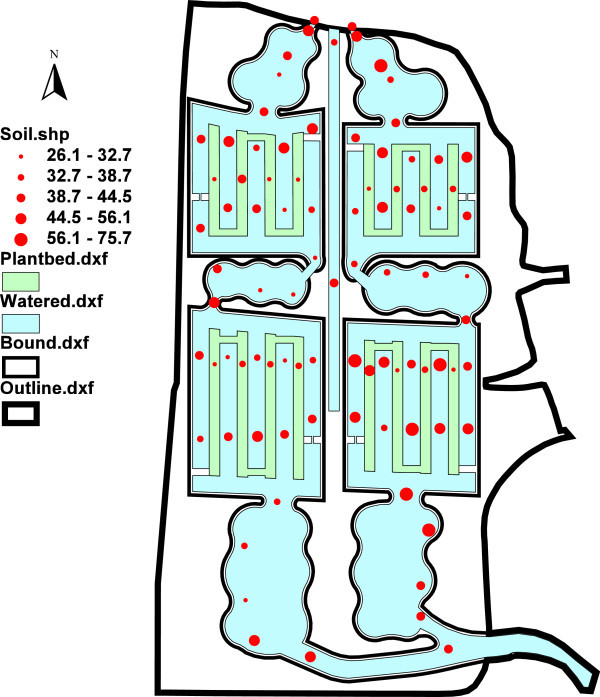
Figure 4.

Potential comprehensive ecological risk index ( RI ) of heavy metals in source river sediment, pond/ditch sediments and plant-bed soils of the pilot wetland. Outline, bound line, watered line, plant bed line represent the outer boundary, inner boundary, watered area (light blue), and plant bed area (light green). The solid red circle illustrates the relative magnitudes of RI. The size range of circles is classified according to Natural Breaks method in ArcView GIS 3.2a.
