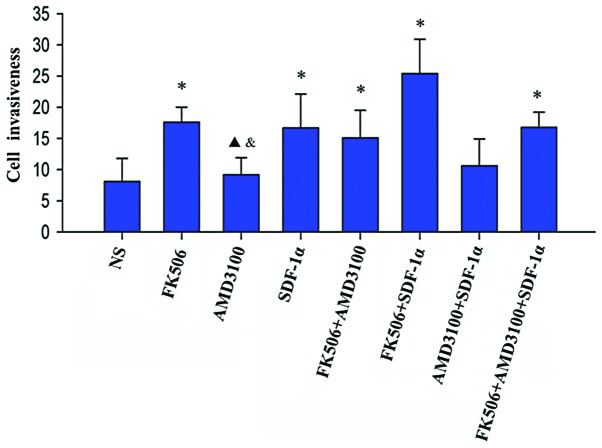
Figure 3.
Changes in the invasiveness of Morris rat hepatoma 3924A (MH3924A) cells following treatment with different agents. The horizontal axis depicts the eight groups of cells depending on the treatment, and the vertical axis represents the invasiveness of MH3924A cells, as assessed by the transwell invasion assay. *P<0.01, compared to the normal saline (NS) group; ▲P<0.05, compared to the tacrolimus (FK506) group; &P<0.05, compared to the stromal cell-derived factor-1α (SDF-1α) group.

