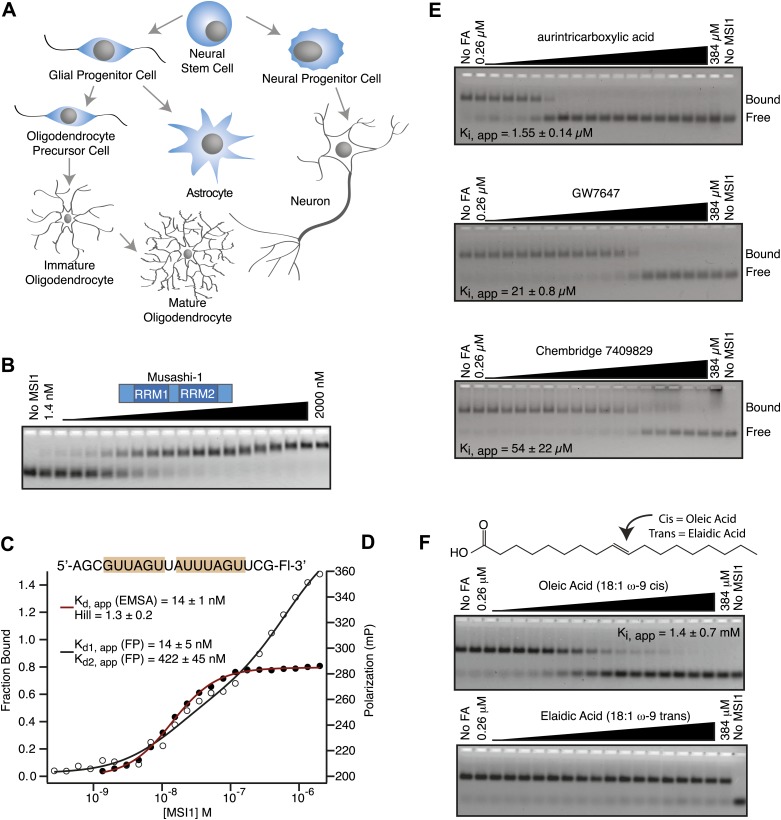
Figure 1. MSI1 is inhibited by monounsaturated fatty acids.
(A) Pattern of MSI1 (blue) in the CNS. (B–D) EMSA and FP of MSI1 binding to RNA aptamer CCCR005 (AGCGUUAGUUAUUUAGUUCG). EMSA data (red line) were fit to the Hill equation where all shifted species were fit as an aggregate. FP data (black line) were fit to a two-site binding model. (E and F) Assay scheme for the inhibitor screen (E) and F–EMSA dose responses with hits identified from the small molecule screens (E) and oleic and elaidic acid (F). Each gel is one representative experiment of at least three independent experiments. No compound and no protein lanes identify the position of bound and free RNA migration, respectively.


