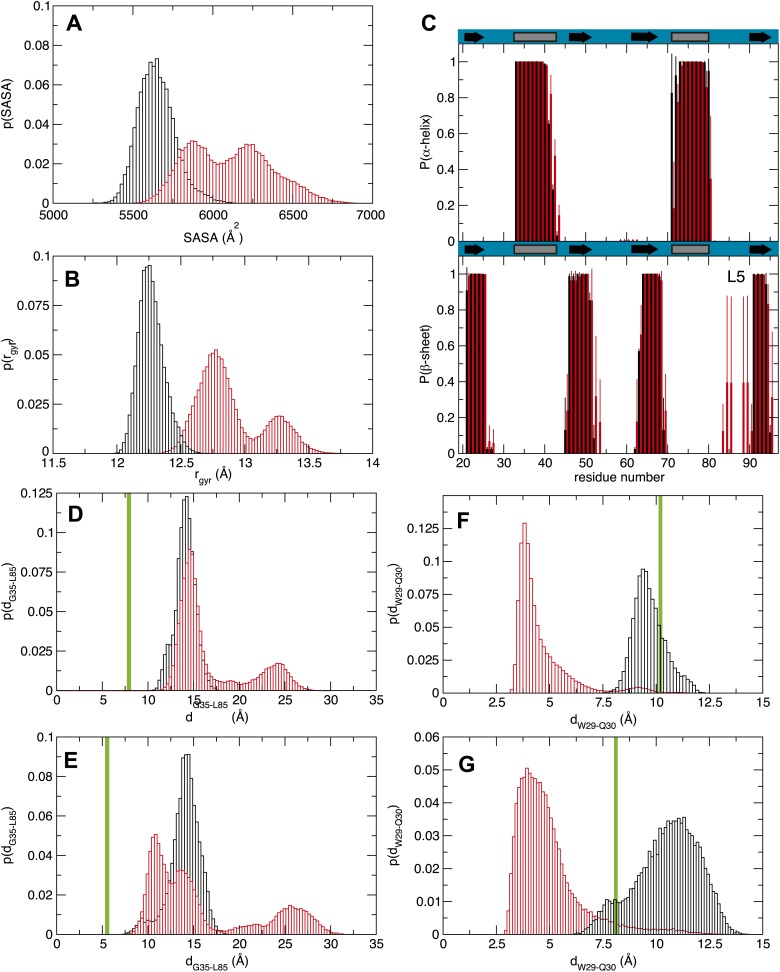
Figure 4.
Molecular dynamics studies (A and B) represent the normalized histograms of the protein solvent accessible surface area (SASA) and radius of gyration (rgyr) illustrating the structural transition undergone by the MSI1 upon oleic acid binding. (A) SASA distributions calculated from the MD trajectories of MSI1 bound to oleic acid and of MSI1 in the apo state are represented in red and black, respectively. (B) Radius of gyration distributions calculated from the MD trajectories of MSI-1 bound to oleic acid and of MSI1 in the apo state are represented in red and black, respectively. (C) The probability of being in an α-helix or β-sheet is shown for each residue of MSI1. The probabilities calculated for each residue from the MD trajectories of MSI1 free and bound to oleic acid are shown in black and red, respectively. Oleic acid binding is associated with stabilization of the C-terminus of α-helix 1, fraying of α-helix 2, at both the N- and C-termini, extension of sheet 2, as well as the formation of an additional β-sheet at loop 5 (L5). (D and E) Normalized histograms of the distance between G35, located on α-helix 1, and L85, located on loop 5, calculated from the MD trajectories of oleic acid-bound MSI-1 and of apo MSI1 are shown in red and black, respectively. The distribution of distances between the Cα atoms of G35 and L85 is depicted in (D). The distribution of distances between the Cα of G35 and the Cδ2 of L85 is shown in (E). The green lines show the values of these distances observed in the NMR structure of MSI1 bound to RNA (PDB ID 2RS2). In the oleic-bound state, loop 5 is restricted in approaching α-helix 1 due to the steric hindrance of the oleic acid. (F and G) Normalized histograms of two representative side chain distances of W29 and Q30. Histograms calculated over the MD trajectories of oleic acid-bound MSI1 are shown in red, those of apo MSI1 in black. The distance between W29 Cε2 and Q30 Cγ is shown in (F). The distance between W29 Cζ2 and Q30 Nε2 is shown in (G). The green lines show these distances observed in the NMR structure of MSI1 bound to RNA (PDB ID 2RS2). In the oleic-bound state, the side chain of W29 is stacked against the side chain of Q30. This conformation of W29 is not observed in either the free or RNA-bound states of MSI1.

