. 2014 Jun 16;3:e02848. doi: 10.7554/eLife.02848

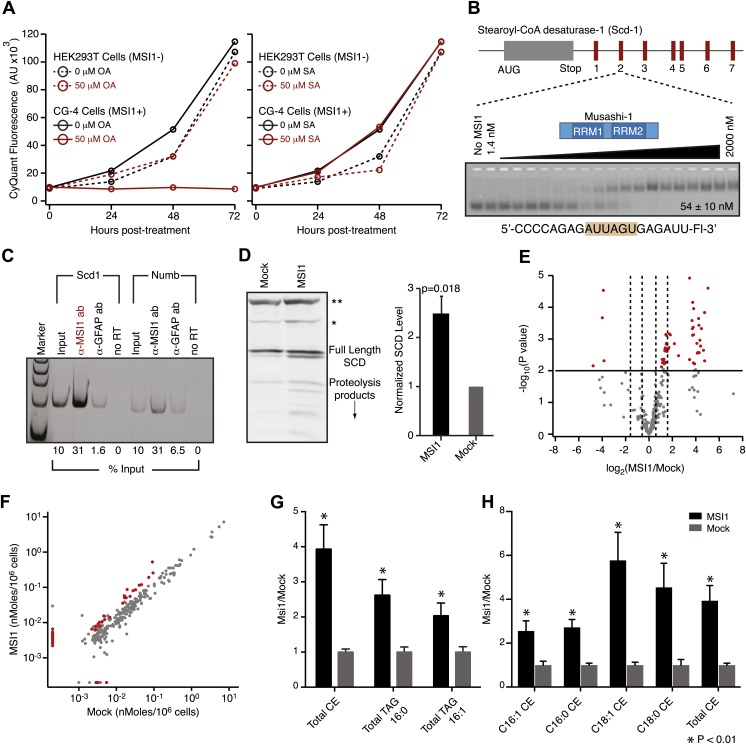
Figure 5. MSI-1 regulates stearoyl-CoA desaturase.

(A) HEK293T (dashed) and CG-4 (solid) cell proliferation as a function of oleic acid or stearic acid treatment (red = treated, black = untreated). The data are the average and standard deviation of at least three biological replicates. (B) There are seven MSI1 consensus sites in the 3′-UTR of Scd-1 mRNA. The Kd, app is the average and standard deviation of at least three experiments. (C) Scd-1 transcripts co-immunoprecipitate with anti-MSI1 antibodies. The data were quantified using a FUJI FLA-5000 imager. (D) Western analysis of SCD expression in HEK293T cells. The data were quantified using the LICOR Odyssey system relative to non specific bands (** and *, Figure 5—figure supplement 2B) to control for loading. The average and standard deviation of at least three independent experiments is shown. (EH) Lipidomics analysis of HEK293T cells ± MSI1 expression. Source data are included in Figure 5—source data 1. (E) Volcano plot of lipidomics data. Dashed lines denote fold-changes of ±1.5 and ±3. Red data points indicate lipids that are significantly changed upon MSI1 expression. (F) Scatter plot of lipidomics data. Data are reported as nMoles per million cells. Red data points indicate lipids that are significantly changed upon MSI1 expression (FDR = 0.05). (G) Fold-changes of the total cholesterol esters and two TAG classes in which 38 of the 54 significantly changing lipids are categorized. Each class changes significantly with MSI1 overexpression (p<0.05). (H) Fold-changes for the four lipids that comprise the total cholesterol esters class. All display significant changes with MSI1 expression (FDR = 0.05).

DOI: http://dx.doi.org/10.7554/eLife.02848.014

Figure 5—source data 1. Lipidomics data files.
elife02848s001.xlsx (4.4MB, xlsx)
DOI: 10.7554/eLife.02848.015

Figure 5.

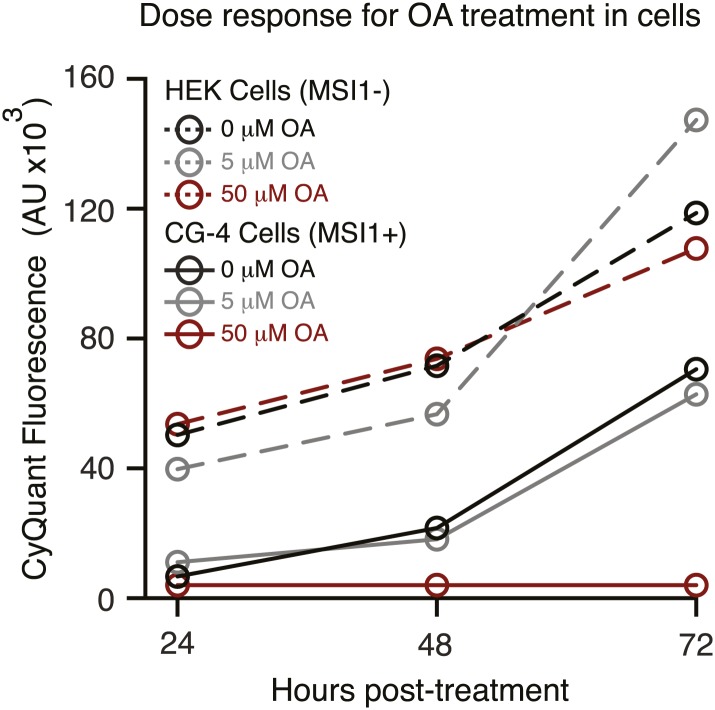
Figure 5—figure supplement 1. Dose response for oleic acid treatment in cell culture.

Figure 5—figure supplement 1.

HEK293T (dashed) and CG-4 (solid) cell proliferation as a function of increasing oleic acid (red = 50 µM, grey = 5 µM, black = 0 µM). The data are the average and standard deviation of at least three biological replicates.
Figure 5—figure supplement 2.

Figure 5—figure supplement 2.

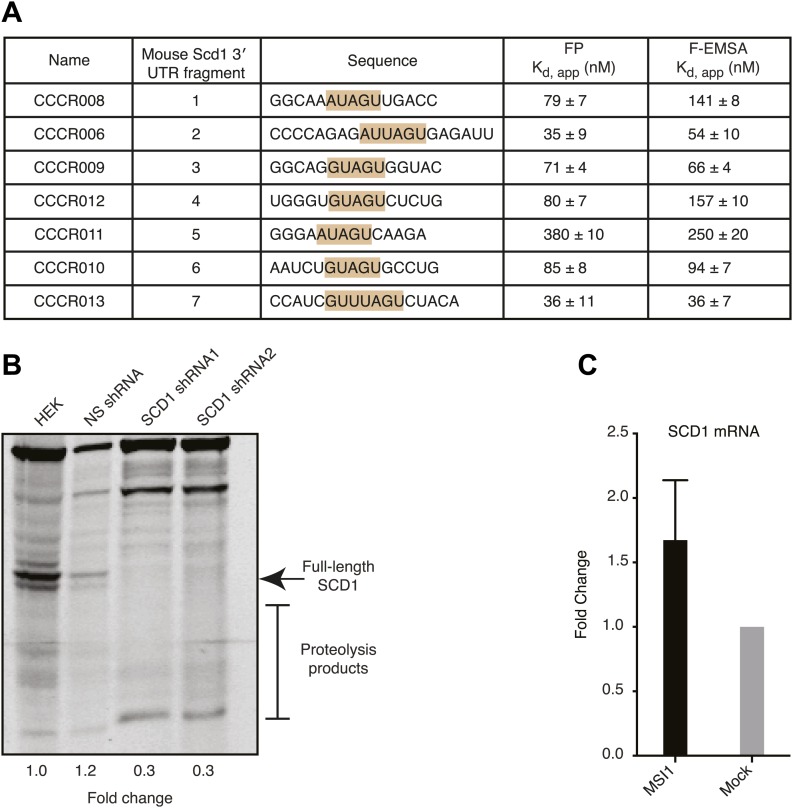
(A) MSI1 binds each of 7 SCD1 3′ UTR fragments containing the MSI1 consensus sequence (G/A)U1–3AGU with variable affinity. FP and F–EMSA binding experiments are reported as the average and standard deviation of three independent experiments. (B) The SCD1 antibody is specific for full-length SCD1 and the associated proteolysis products. Two independent shRNA constructs reduced full-length SCD1 and associated proteolysis products compared to non-transfected or control shRNA-transfected HEK293T cells. (C) qRT-PCR of SCD1 mRNA. The data are the mean and SD of the fold-change in SCD1 mRNA from five independent experiments. Each experiment comprised three technical replicates normalized to tubulin or GTF2i.
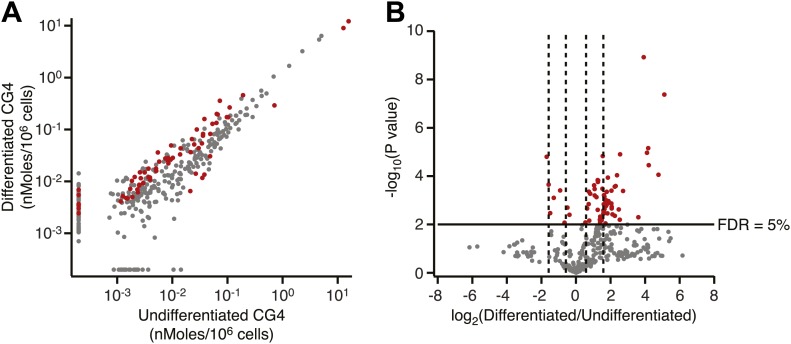
Figure 5—figure supplement 3. Lipidomics analysis of undifferentiated and differentiated CG4 oligodendrocyte progenitor cells.

Figure 5—figure supplement 3.

(A) Scatter plot of lipidomics data for differentiated vs undifferentiated CG4 cells. Data are reported as nMoles per million cells. Red data points indicate lipids that are significantly different after differentiation (FDR = 5%). (B) Volcano plot of lipidomics data. Dashed lines denote fold-changes of ±1.5 and ±3.