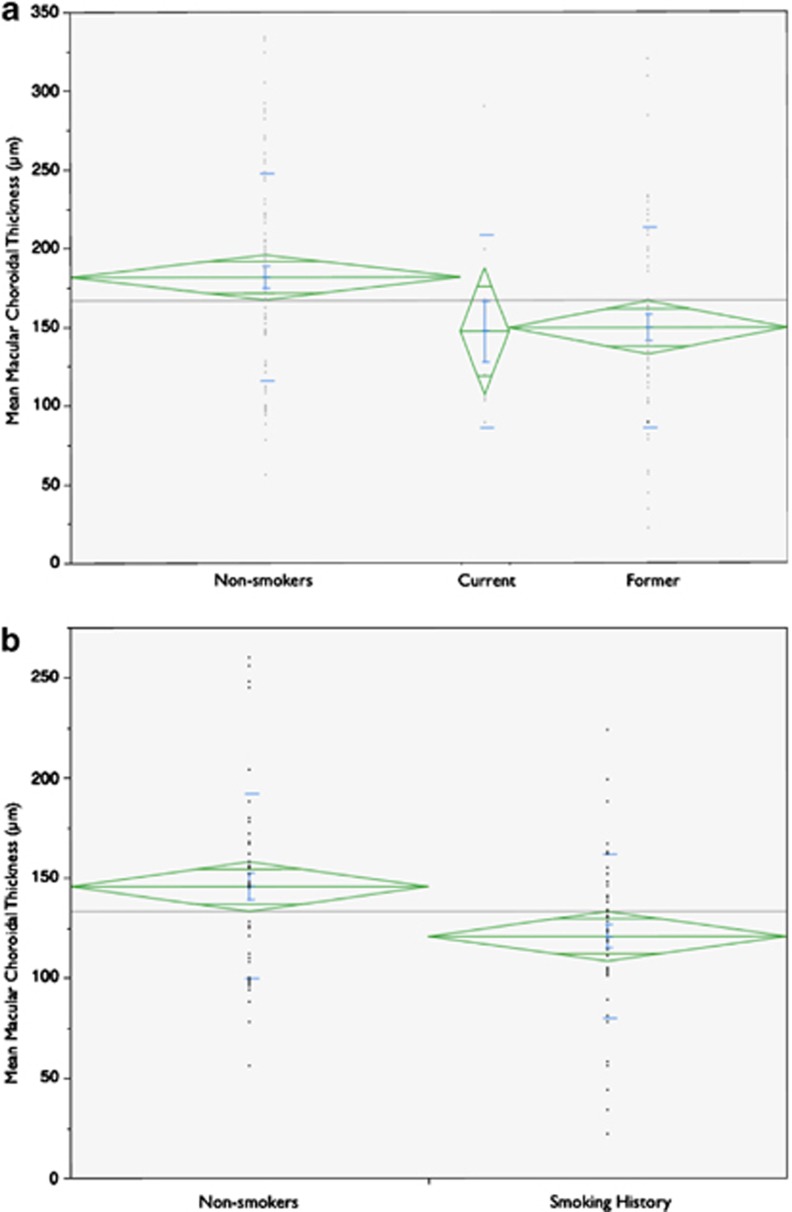
Figure 2.
Comparison of mean macular choroidal thickness (CT) among smoking categories. (a) One-way analysis of variance (ANOVA) between lifetime nonsmokers, current smokers, and former smokers; green diamonds vertically centered on mean spanning 1 SD; horizontal width proportional to sample size; mean CT as follows: nonsmokers, 181±65, n=80; current smokers, 147±61, n=10; former smokers, 149±64 μm, n=57; P=0.011; (b) Two-sample t-test subgroup analysis of patients with drusen or early AMD; mean CT is as follows: nonsmokers, 146±46 μm, n=49; history of smoking, 121±41 μm, n=49; P=0.006.

