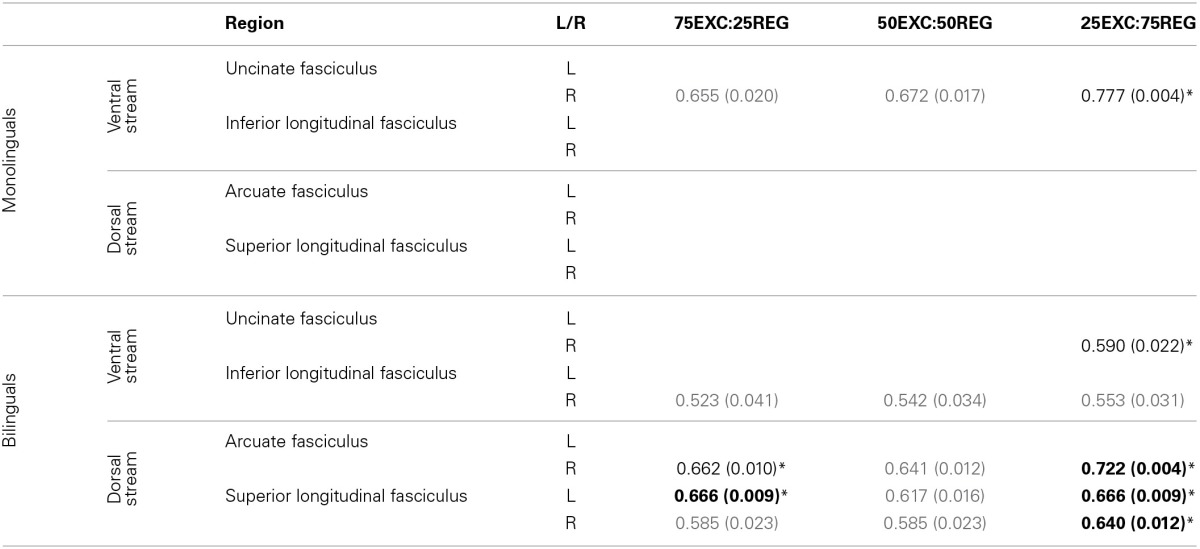
Table 2.
Pearson's r-value (p-value) for correlation between MD values and RT in monolingual and bilingual groups.

The correlations survived after FDR correction and 90% of leave one-out tests are denoted by *, vs. those who did not (gray color). The values in bolded face show significantly higher correlation in the bilingual group than in monolingual group.
