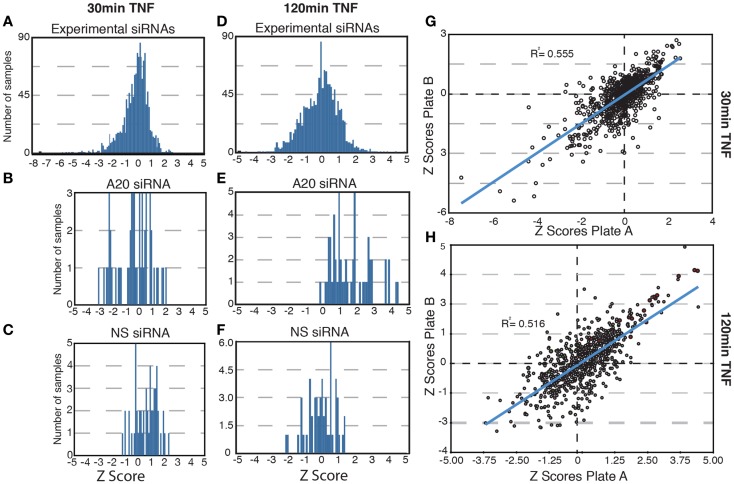
Figure 2.
Results of a high-content screen for ubiquitin modifiers of NF-κB. (A–E) The distribution of z-scores are shown for all samples (A,D); samples treated with control, non-silencing siRNAs (NS, C, and F); or samples treated with controls A20 siRNA (B,E). (A–C) Show the z-score distributions for all samples at 30 min TNF and (D–F) show the z-score distribution for all samples at 120 min TNF. (G–H) Scatterplots show the replicate z-scores for the respective siRNAs at 30 min TNF (G) and 120 min TNF (H). (H) Red dots show the z-scores for control A20 siRNAs and green dots show the z-scores for control non-silencing siRNAs.

