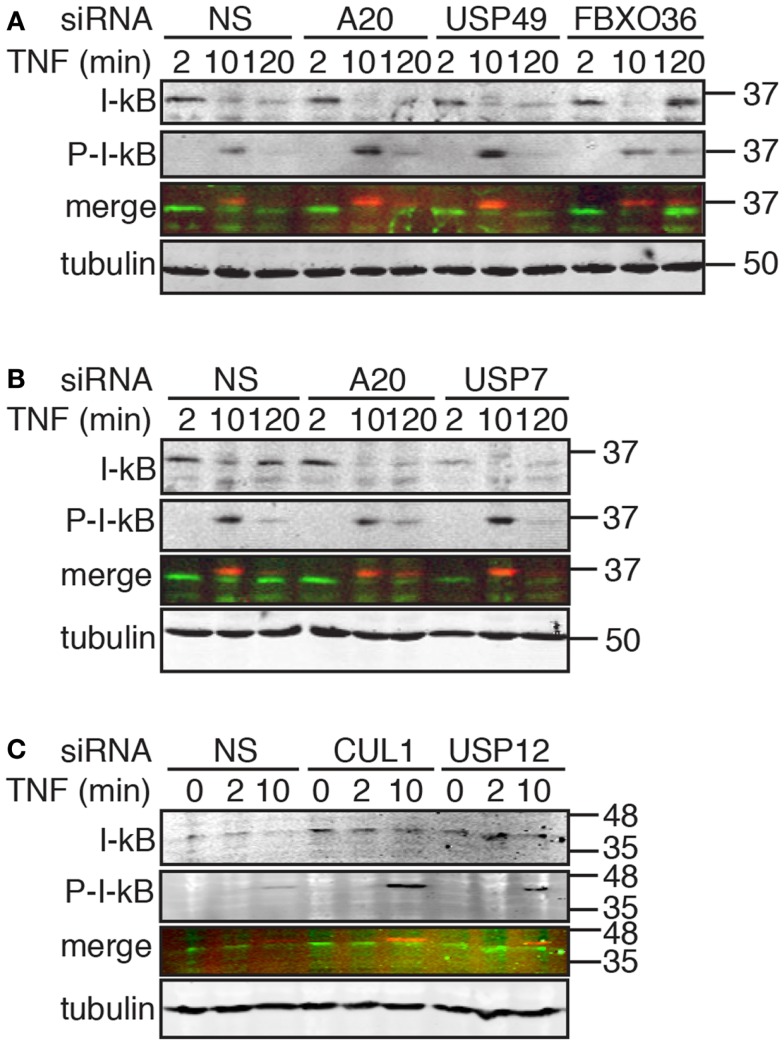
Figure 8.
Western blot evaluation of total I-κB and phosphorylated I-κB (P-I-κB) in cells treated with the indicated siRNAs and incubated with TNF for the indicated times. In the merged images, I-κB is shown in green and P-I-κB is shown in red. Tubulin is shown as a loading control and numbers on the side indicate molecular weights in kilodaltons.

