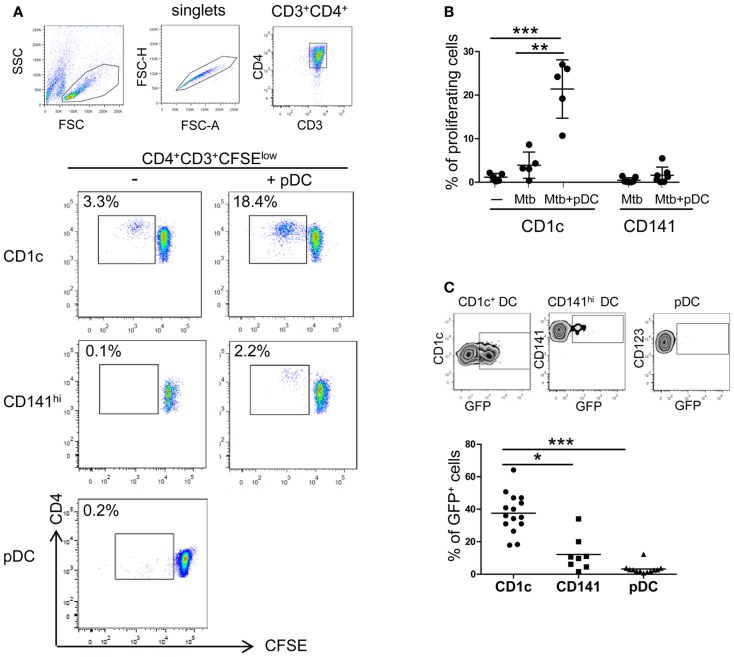
Figure 4.
CD4+ T cell activation by CD1c+ DCs. (A) and (B) Naïve CD4 T cells were labeled with CFSE and proliferation was measured after 7 days of culture in the presence of autologous CD1c+ DCs ± pDCs (CD1c), CD141hi DCs ± pDCs (CD141hi), or pDCs alone (pDC) previously stimulated with live Mtb for 16 h. DC:T cell ratio was 1:10. (A) One representative flow cytometric CD4 T cell staining shown; lymphocytes were gated according to morphological parameters and doublets excluded. Proliferating CD4+ T cells were gated as CD4+CD3+CFSElow cells. (B) Mean ± SD of proliferating CD4+ T cells in response to CD1c+ DCs ± pDCs or CD141hi DCs ± pDCs of at least five donors in two independent experiments. (C) One representative gating strategy of Mtb-infected CD1c+ DCs (top left), CD141hi DCs (top middle), and pDCs (top right) and mean ± SD of Mtb-infected cells of at least eight donors in four independent experiments (bottom). Cells were infected at MOI 5 with Mtb-expressing GFP and stained for specific DC marker after 16 h. Infected cells were measured as percentage of GFP+ cells. Kruskal–Wallis ANOVA; *p < 0.05, **p < 0.01, ***p < 0.001.

