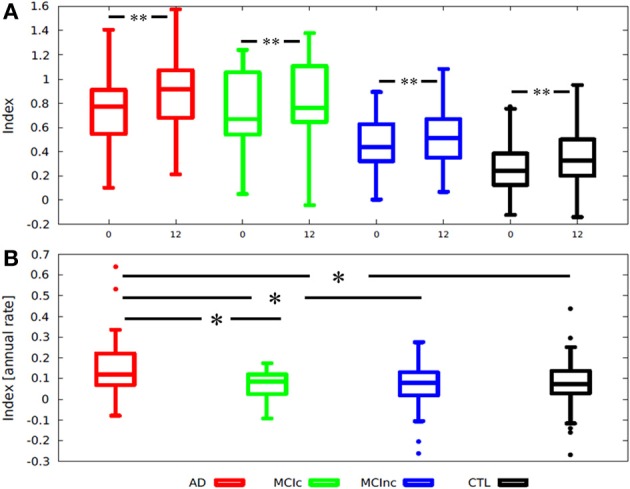
Figure 2.

Box-plots illustrating the distribution of (A) an MRI index according to diagnosis and stratified by time point; (B) Index annual rate of change stratified by diagnosis. Index annual rate of change = index at 1-year − index at baseline. *One-tailed T-test p < 0.002; **One-tailed paired T-test p < 0.003; AD, Alzheimer disease; MCI-c, MCI converter; MCI-nc, MCI non-converter (stable); MCI, mild cognitive impairment; CTL, healthy control.
