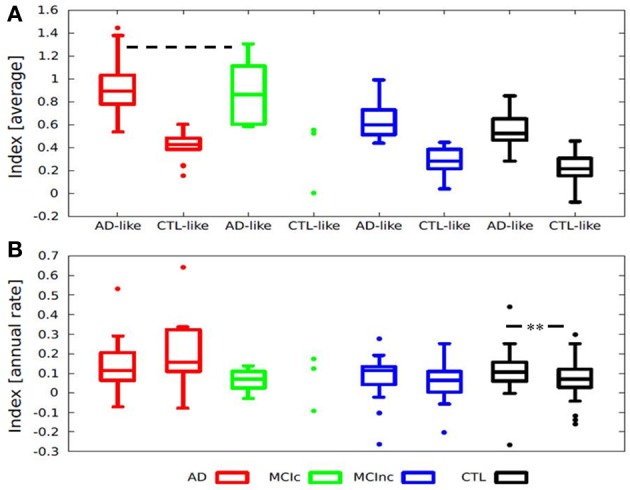
Figure 4.

Box-plots illustrating the distribution of (A) Average index according to diagnosis and stratified by pattern of atrophy, all groups are significantly different except for AD-like AD and AD-like MCI-c (--- Two-sided T-test p = 0.76). (B) Index annual rate of change stratified by diagnosis and pattern of atrophy. Index annual rate of change = index at 1-year − index at baseline. **Mann-Whitney p = 0.028; Average index = (Index at baseline + index at 1-year)/2. AD, Alzheimer disease; MCI-c, MCI converter; MCI-nc, MCI non-converter (stable); MCI, mild cognitive impairment; CTL, healthy control.
