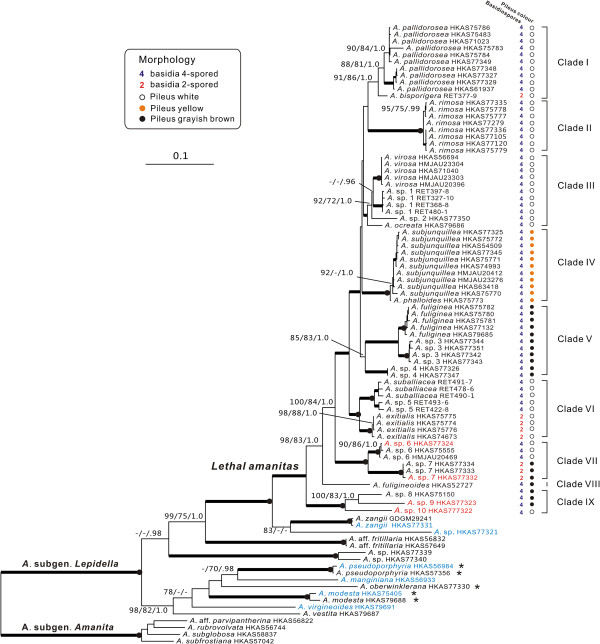
Figure 1.

Phylogenetic tree inferred from maximum likelihood (ML) analysis based on the combined dataset (nrLSU, rpb2, ef1-α and β-tubulin). Only maximum likelihood bootstraps (LB) and maximum parsimony bootstraps (PB) over 70%, and Bayesian posterior probabilities (PP) over 0.90 are reported on the branches. Thickened branches indicate LB and PB between 90%–100%, and PP between 0.95–1.0. Thickened branches with dots on the root nodes represent 100% LB/PB and 1.0 PP values. The species names in red and blue colour indicate that toxins were detected and were not detected respectively in our biochemical analyses. Species, which were previously allocated in the section Phalloideae and later nested in the section Lepidella, are highlighted by asterisks after their names.
