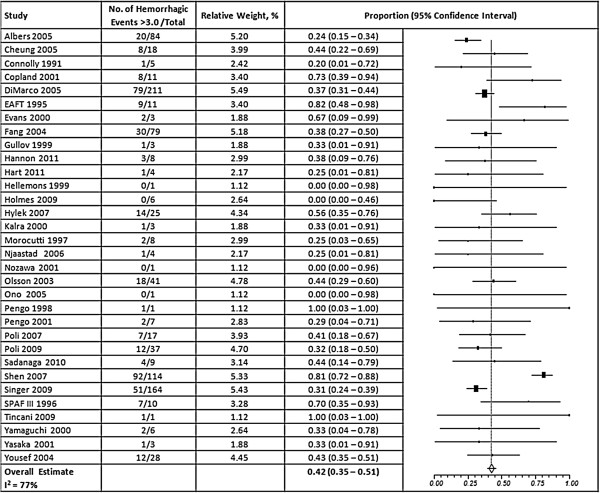
Figure 3.

Results of random-effects meta-analysis of the proportion of major hemorrhagic events that occurred when INRs were above 3.0. The squares represent individual studies, and the size of the square represents the weight given to each study in the meta-analysis. Error bars represent 95% confidence intervals. The diamond represents the combined results. List of studies shows name of first author and year of publication. CI = Confidence Interval.
