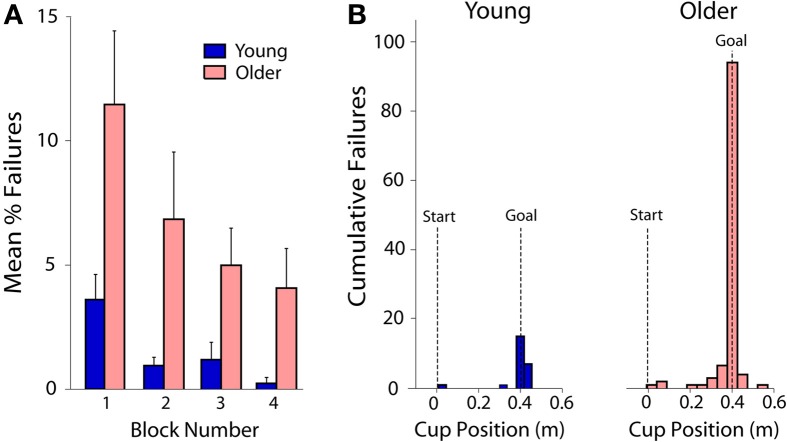
Figure 3.
(A) Both young and older subjects decreased their failure rate with practice, but older adults failed more often overall. Failure was defined when the ball exceeded the escape angle. The bars show the mean percentage of failures for young (blue bars) and older (red bars) across the four blocks of practice. Error bars show standard error. Each block includes 60 trials. (B) Failure rate as a function of cup position for young and old subjects separately. By far the riskiest part of the ball and cup transit was stopping in the goal (at 0.4 m). Shown is the number of failed trials across all subjects as a function of the cup position at the time of failure.

