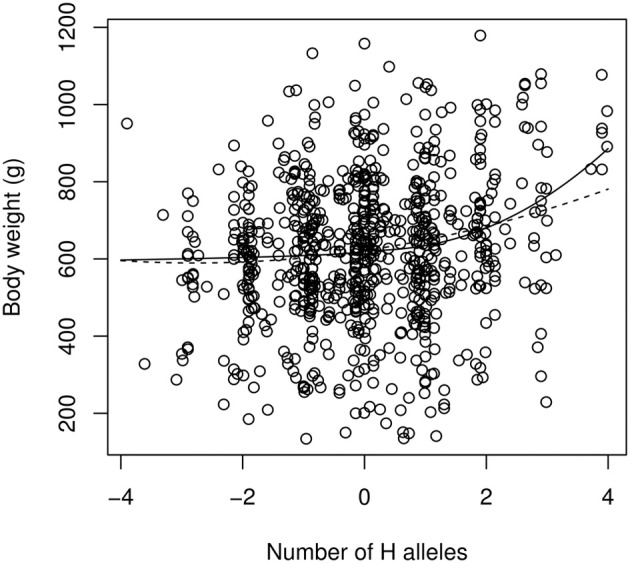
Figure 5.

The continuous version of the power model (Equation 7, solid line) and the quadratic model of epistasis (dashed line) applied to the chicken QTL data. The reference genotype contains as many “low” (L) alleles as “high” (H) alleles. The x-axis scales from −4 (LL genotype at all loci) to +4 (HH genotype at all loci). Intermediate numbers of mutations are due to genotype uncertainties when QTLs are not in total linkage disequilibrium with markers.
