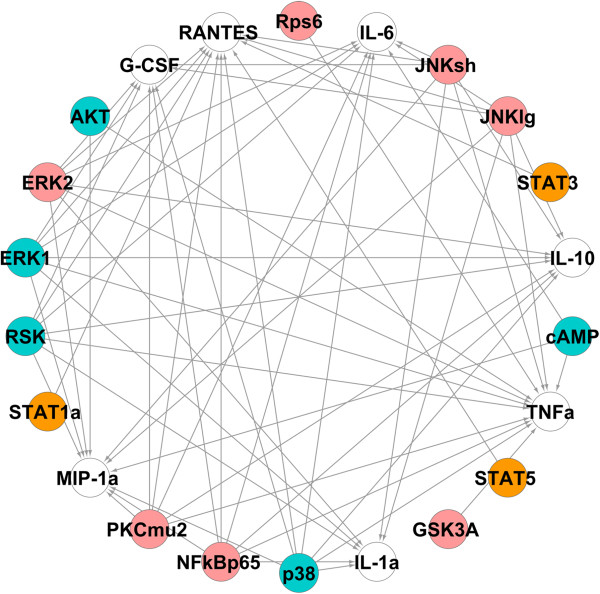
Figure 4.

The reconstructed phosphoprotein-cytokine network obtained by combining networks from non-Toll dataset (orange nodes) and Toll dataset (pink nodes). Blue nodes are phosphoproteins involved in both datasets and white nodes represent the cytokines (outputs).
