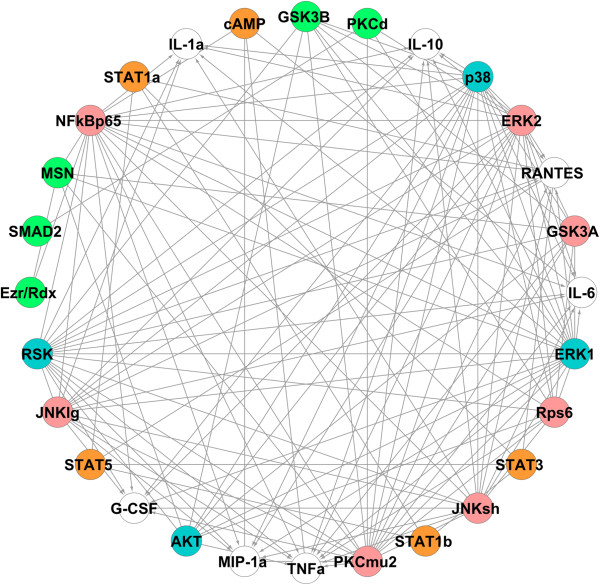
Figure 6.

The reconstructed phosphoprotein-phosphoprotein/cytokine network from combining networks from non-Toll dataset (orange) and Toll dataset (pink). The white nodes represent the cytokines, blue nodes are involved in cytokine regulation from both datasets and green nodes are not directly involved in cytokine regulation.
