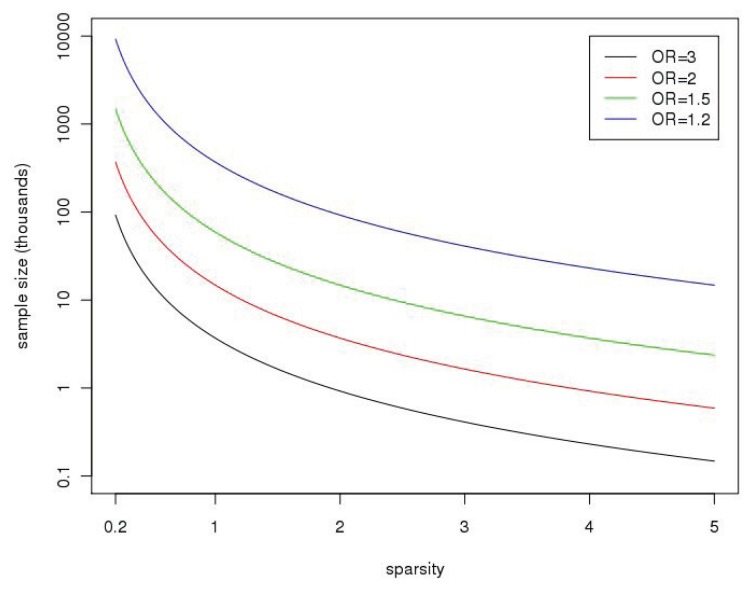
Figure 1.
The plot shows the sample sizes (on the y-axis, in thousands) needed to achieve 80% power at the 10−6 significance level as a function of “sparsity”, (on the x-axis), with k and k1 as defined in the text. It is assumed for these calculations that the k SNPs are independent (no linkage disequilibrium), with the minor allele frequency (MAF) sampled from a beta distribution with parameters selected to match allele frequencies from the CEU of the 1000 Genomes Project, B(0.14,0.73); the distribution is truncated at 0.01 (so SNPs have MAF < 1%) and only polymorphic SNPs when sequencing 10,000 subjects are selected. Calculations are based on the NCP in Equation (1). OR, odds ratio.

