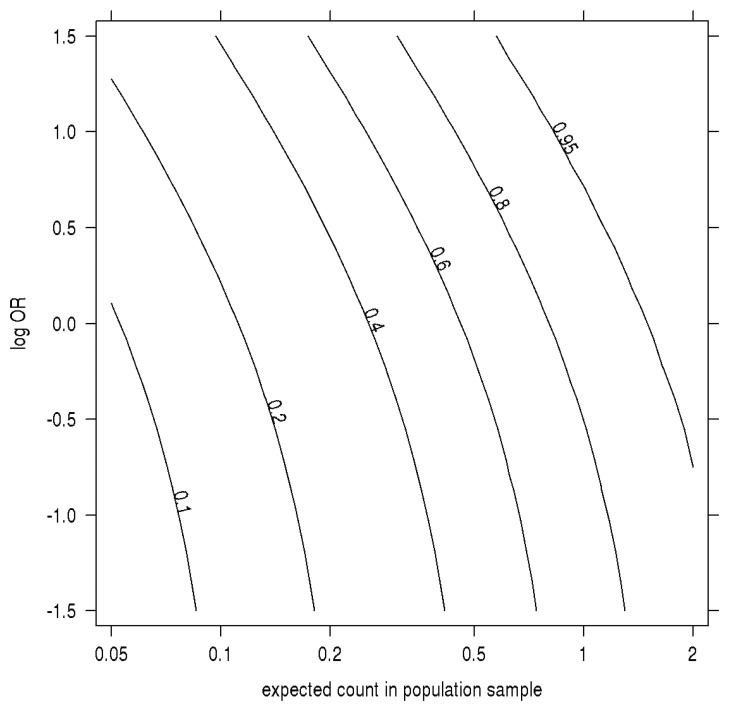
Figure 2.
Sampling probability by MAF, log odds-ratio. The contour plot has on the x-axis the allelic expected count in a population sample the same size as the control group (sample sizes times MAF) and, on the y-axis, the log-odds ratio. Contours are the absolute probability of being sampled in a case-control study of 100 cases and 100 controls when prevalence equals 1%.

