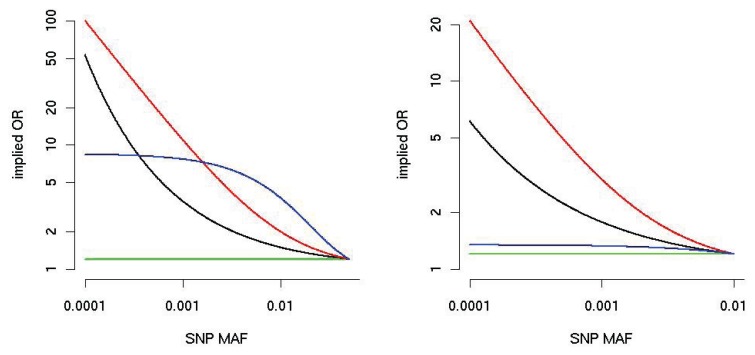
Figure 4.
Implied alternative OR (on the y-axis, logarithmic scale) as a function of MAF (x-axis) for three burden weighting schemes. The black line corresponds to the Madsen– Browning weight [10]; the red line corresponds to the attributable risk weight [41], and the blue line corresponds to the default in SKAT, Beta(25,1) [42]; the green line is for equal weights. For the left panel, the MAF is truncated at 5%, and for the right panel at 1%. We assume that the OR of the SNP with the largest MAF is 1.2.

