Figure 2.

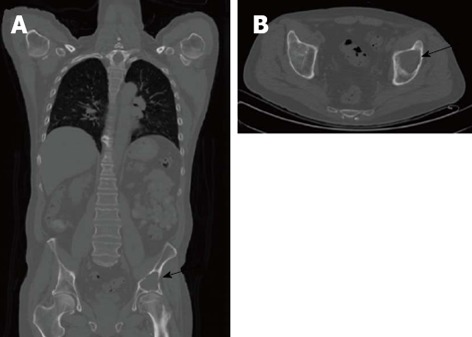
Computed tomography of an osseous myeloma lesion. Computed tomography in coronal (A) and transversal views (B) showing an osteolytic lesion in the left iliac bone (arrows) representing an osseous myeloma manifestation.

Computed tomography of an osseous myeloma lesion. Computed tomography in coronal (A) and transversal views (B) showing an osteolytic lesion in the left iliac bone (arrows) representing an osseous myeloma manifestation.