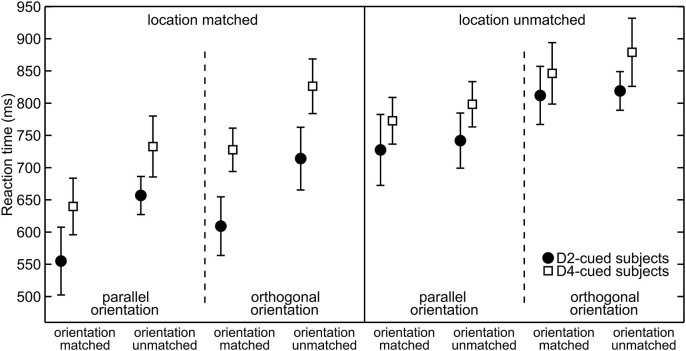
Figure 3.
Reaction times grouped with respect to target properties. Separately for each cue-location group (for D2-cued/D4-cued subjects depicted by filled circles/open squares), the mean reaction times (RTs) (mean and repeated-measures 95% confidence intervals) are plotted. Responses to location-matched/location-unmatched targets are shown in the left/right half of the plot. Further on, these halfs are divided into parallel (left) and orthogonal (right) targets. The abscissa further sorts between orientation-matched (left) and orientation-unmatched targets (right).

