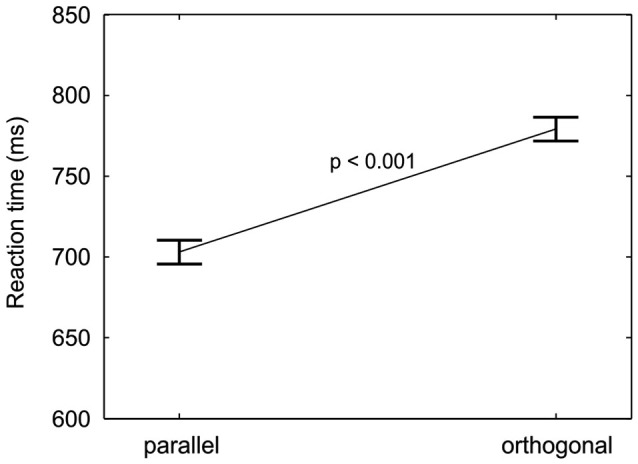
Figure 5.

Orientation anisotropy. RTs (mean and repeated-measures 95% confidence intervals, pooled across cue-location groups, location validities, and orientation validities) are plotted for the two target orientations. A significant decrease in reaction time from orthogonal to parallel targets is found.
