
Figure 1.
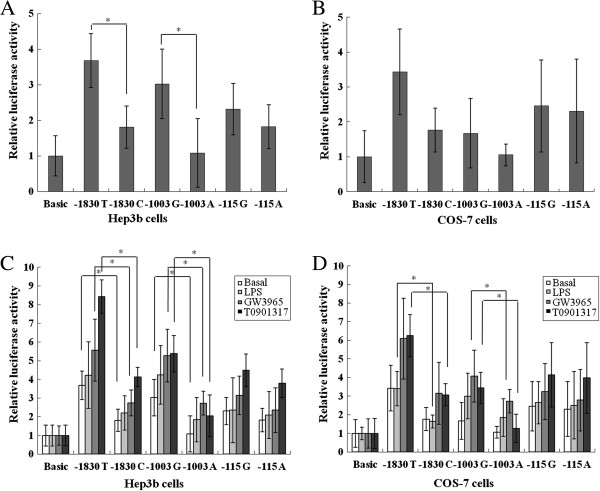
Functional effect of the polymorphisms on transcriptional activity. (A, B) Relative luciferase production (ratio of luciferase production driven by the reporter construct to that by the promoter-less control vector, pGL3-Basic) in Hep3B cells (A) and COS-7 cells (B). (C, D) Relative luciferase production by stimulation with 200 ng/mL LPS, 3 μmol/L GW3965 and 5 μmol/L T0901317 in Hep3B cells (C) and COS-7 cells (D). The P value was determined by a paired t test. *P <0.05. LPS, lipopolysaccharide.