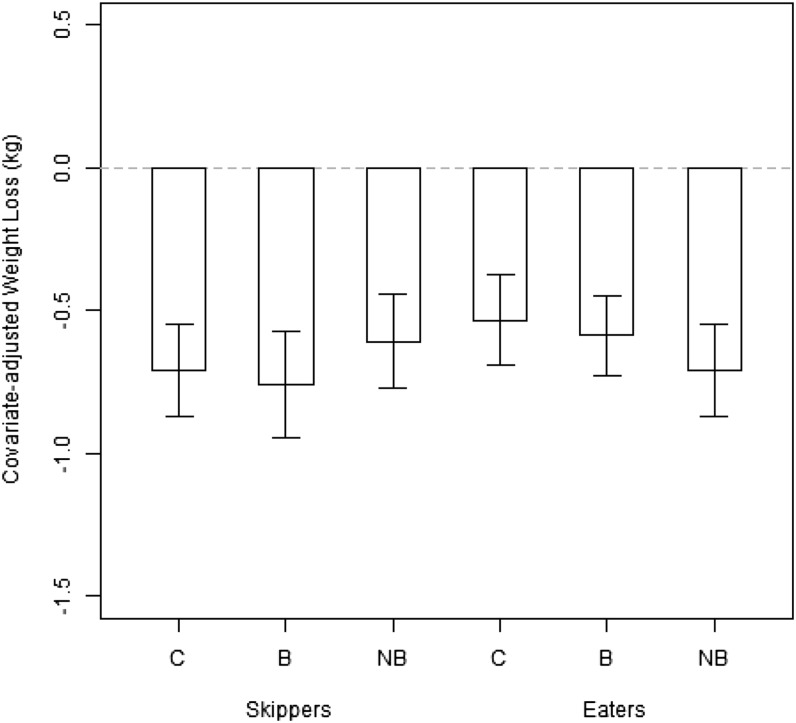
FIGURE 2.
Mean (±SD) covariate-adjusted weight changes by treatment and stratification. The gray dashed line represents “0” or no weight change from baseline. ANOVA found no significant effects of treatment or stratification on weight change. Among breakfast skippers, baseline mean (±SD) weight-, age-, sex-, site-, and race-adjusted weight changes were −0.71 ± 1.16, −0.76 ± 1.26, and −0.61 ± 1.18 kg for the C, B, and NB groups, respectively. Among breakfast eaters, baseline mean (±SD) weight-, age-, sex-, site-, and race-adjusted weight changes were −0.53 ± 1.16, −0.59 ± 1.06, and −0.71 ± 1.17 kg for the C, B, and NB groups, respectively. B, breakfast group; C, control group; NB, no-breakfast group.

