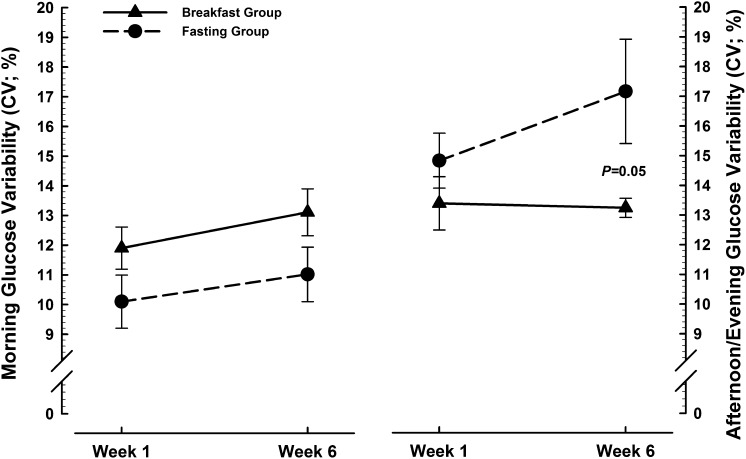
FIGURE 4.
Glucose variability before and after 1200 (expressed as CVs) derived from subcutaneous glucose concentrations continuously monitored during the first and last week of either ingesting ≥700 kcal before 1100 daily (breakfast group; n = 16) or abstaining from all energy-providing nutrients until at least 1200 daily (fasting group; n = 16). Values are means ± SEs. Two-factor ANOVA (treatment × time) showed a nonsignificant trend for treatment (F = 3.9, P = 0.06) with no significant effect of time nor any interaction of these factors during the morning (left side of panel) and a significant effect of treatment (F = 6.2, P = 0.02) with nonsignificant trends for time (F = 3.8, P = 0.06) and treatment × time (F = 3.6, P = 0.07) during the afternoon/evening (right side of panel).

