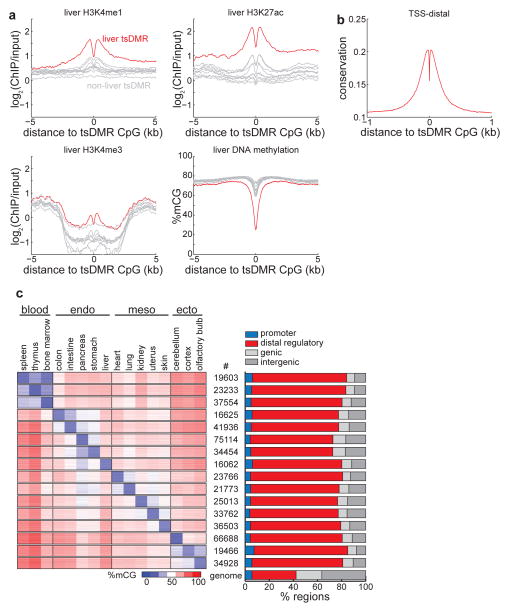
Figure 3. Tissue-specific methylated regions are predominantly regulatory elements.
(a) Enrichment of H3K4me1 (top left), H3K4me3 (bottom left), H3K27ac (top right), and DNA methylation (bottom right) in liver cells for liver tsDMRs (red) and tsDMRs identified in other tissues (grey). Bone marrow is immediately below liver in the H3K4me3 plot. (b) Average PhastCons conservation scores relative to tsDMRs. Higher values indicate more conservation. (c) (left) Heatmap representing the abundance of DNA methylation for tsDMRs in all tissues. Each row indicates a tsDMR, which are grouped into horizontal blocks that represent the tsDMRs of a tissue, with the number of elements in the block displayed in the middle. A given tsDMR may appear more than one block. (right) The percentage of tsDMRs in each block within 500bp of promoters, distal regulatory elements (enhancers and CTCF binding sites), genic regions, and intergenic regions. The genome-wide average is indicated below.

