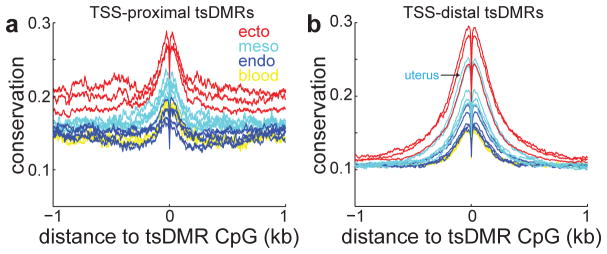
Figure 4. Tissue-specific conservation of regulatory elements.

Average PhastCons conservation scores relative to tsDMRs that are (a) proximal (within 2.5-kb) or (b) distal (beyond 2.5-kb) to annotated transcription start sites (TSS). Higher values indicate more conservation.
