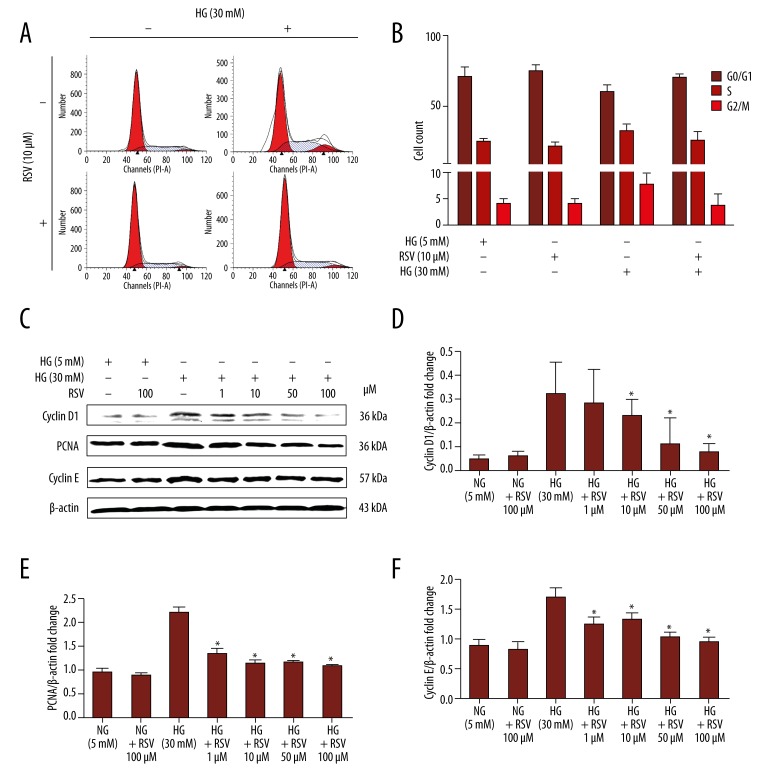
Figure 4.
Effect of resveratrol on HG-induced VSMC proliferation and expression of proliferation-related proteins. (A) Representative histograms showing cell cycle distribution upon HG treatment (30 mM, 24 h) in the presence or absence of resveratrol (10 μM). (B) Bar graph summarizing cell cycle data. (C) Representative immunoblot detecting levels of expression of cyclin D1, PCNA, and cyclin E in HG-treated VSMCs in the presence or absence of resveratrol (10 μM). (D–F) Quantified band density for cyclin D1, PCNA, and cyclin E. Values are expressed as means ±S.D. from 3 independent experiments. * P<0.01 indicates significant difference from the HG (30 mM) group.

